This originally appeared at https://www.ncbi.nlm.nih.gov/pmc/articles/PMC4311234/pdf/srep08126.pdf
A comparative risk assessment of drugs including alcohol and tobacco using the margin of exposure (MOE)
approach was conducted. The MOE is defined as ratio between toxicological threshold (benchmark dose)
and estimated human intake. Median lethal dose values from animal experiments were used to derive the
benchmark dose. The human intake was calculated for individual scenarios and population-based scenarios.
The MOE was calculated using probabilistic Monte Carlo simulations. The benchmark dose values ranged
from 2 mg/kg bodyweight for heroin to 531 mg/kg bodyweight for alcohol (ethanol). For individual
exposure the four substances alcohol, nicotine, cocaine and heroin fall into the ‘‘high risk’’ category with
MOE , 10, the rest of the compounds except THC fall into the ‘‘risk’’ category with MOE , 100. On a
population scale, only alcohol would fall into the ‘‘high risk’’ category, and cigarette smoking would fall into
the ‘‘risk’’ category, while all other agents (opiates, cocaine, amphetamine-type stimulants, ecstasy, and
benzodiazepines) had MOEs . 100, and cannabis had a MOE . 10,000. The toxicological MOE approach
validates epidemiological and social science-based drug ranking approaches especially in regard to the
positions of alcohol and tobacco (high risk) and cannabis (low risk).
Compared to medicinal products or other consumer products, risk assessment of drugs of abuse has been
characterised as deficient, much of this is based on historical attribution and emotive reasoning 1 . The
available data are often a matter of educated guesses supplemented by some reasonably reliable survey data
from the developed nations2 . Only in the past decade, have there been some approaches to qualitatively and
quantitatively classify the risk of drugs of abuse. These efforts tried to overcome legislative classifications, which
were often found to lack a scientific basis 3 . UNODC suggested the establishment of a so-called Illicit Drug Index
(IDI), which contained a combination of a dose index (the ratio between the typical dose and a lethal dose) and a
toxicology index (concentration levels in the blood of people who died from overdose compared with the
concentration levels in persons who had been given the drug for therapeutic use) 4 . King and Corkery 5 suggested
an index of fatal toxicity for drugs of misuse that was calculated as the ratio of the number of deaths associated
with a substance to its availability. Availability was determined by three separate proxy measures (number of users
as determined by household surveys, number of seizures by law enforcement agencies and estimates of the market
size). Gable 6 provided one of the earliest toxicologically founded approaches in a comparative overview of
psychoactive substances. The methodology was based on comparing the ‘‘therapeutic index’’ of the substances,
which was defined as the ratio of the median lethal dose (LD50) to the median effective dose (ED50). The results
were expressed in a qualitative score as safety margin from ‘‘very small’’ (e.g. heroin) to ‘‘very large’’ (e.g.
cannabis). In a follow-up study, Gable 7 refined the approach and now provided a numerical safety ratio, which
allowed a rank-ordering of abused substances.
Despite these early efforts for toxicology-based risk assessments, the most common methods are still based on
expert panel rankings on harm indicators such as acute and chronic toxicity, addictive potency and social harm,
e.g. the approaches of Nutt et al. 8,9 in the UK and of van Amsterdam et al. 3 in the Netherlands. The rankings of the
two countries correlated very well 3,8
. Similar studies were conducted by questioning drug users, resulting in a high
correlation to the previous expert judgements 10–12 . The major criticism that was raised about these ‘‘panel’’ based
approaches was the necessity of value judgements, which might depend upon subjective personal criteria and not only upon scientific facts 13 .
The methodology was also criticized
because a normalization to either the total number of users or the
frequency of drug use was not conducted, which might have biased
the result toward the harms of opiate use 14 and may have under-
represented the harms of tobacco 15 . Problematic may also have been
the nomenclature applied in previous studies, mixing up ‘‘hazard’’
and ‘‘risk’’ into the term ‘‘drug harm’’. In chemical and toxicological
risk assessment, the term ‘‘harm’’ is not typically used, while hazard is
the ‘‘inherent property of an agent or situation having the potential to
cause adverse effects when an organism, system, or (sub)population
is exposed to that agent’’. Risk is defined as ‘‘the probability of an
adverse effect in an organism, system, or (sub)population caused
under specified circumstances by exposure to an agent’’ 16 .
In the context of the European research project ‘‘Addiction
and Lifestyles in Contemporary Europe – Reframing Addictions
Project’’, the aim of this research was to provide a comparative
risk assessment of drugs using a novel risk assessment metho-
dology, namely the ‘‘Margin of Exposure’’ (MOE) method. The
Margin of Exposure (MOE) is a novel approach to compare the
health risk of different compounds and to prioritize risk manage-
ment actions. The MOE is defined as the ratio between the point
on the dose response curve, which characterizes adverse effects in
epidemiological or animal studies (the so-called benchmark dose
(BMD)), and the estimated human intake of the same compound.
Clearly, the lower the MOE, the larger the risk for humans. The
BMD approach was first suggested by Crump 17 , and was later
refined by the US EPA for quantitative risk assessment 18 . In
Europe, the MOE was introduced in 2005 as the preferred method
for risk assessment of carcinogenic and genotoxic compounds 19 .
In the addiction field, the MOE method was never used, aside
from evaluating substances in alcoholic beverages 20,21 or tobacco products 22,23 . This study is the first to calculate and compare
MOEs for other addiction-related substances.
Results
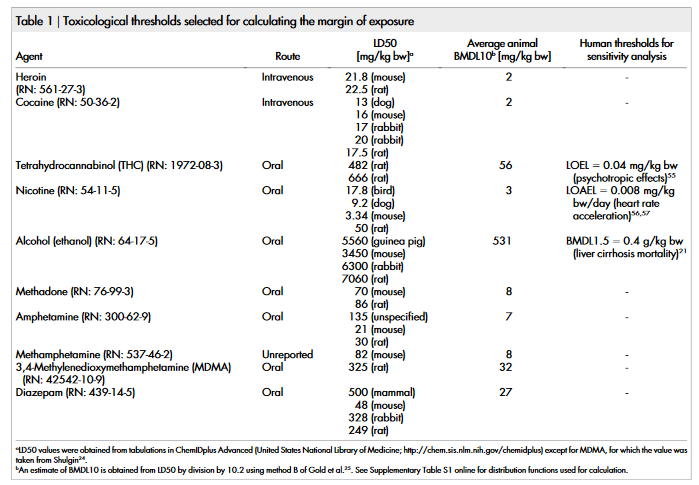
The only toxicological threshold available in the literature for all of
the compounds under study was the LD50. The LD50 values taken
from the ChemIDplus database of the US National Library of
Medicine and from Shulgin 24 are shown in table 1. Using the method
of Gold et al. 25 , the LD50 values were extrapolated assuming linear
behaviour (as no other information on dose-response is available) to
BMDL10 values. As shown in Supplementary Table S1 online, the
full range of available LD50 values in different animal species is taken
into account as a risk function assuming a normal distribution for
BMDL10 rather than that a single value is entered into the calculation
(except methamphetamine and MDMA for which only one value
was available in the literature). The mean values of BMDL10 range
from 2 mg/kg bodyweight (bw) for heroin and cocaine up to
531 mg/kg bw for ethanol.
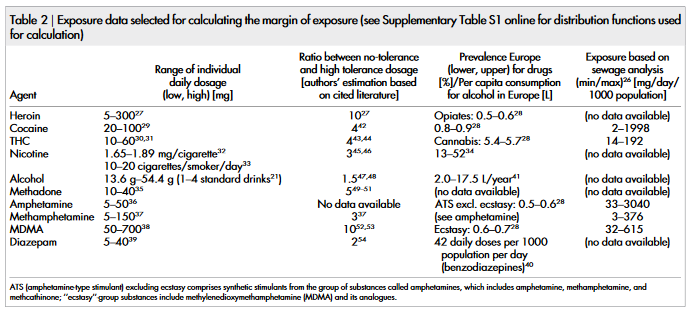
To determine the typical range of individual daily dosage, various
textbook and internet sources 21,26–41 were evaluated (Table 2). As no
information about the most likely function for dosage distribution is
available, a uniform probability distribution was entered into the
calculation in this case (Supplementary Table S1).
The data used for calculation of population-based exposure is
shown in Table 2. Prevalence data was available for all drugs except
methadone; and amphetamine and methamphetamine were grouped
together. For a sub-group of drugs, exposure estimation based on
sewage analysis is available (Table 2) (not all drugs are available in
sewage analysis due to different stabilities/degradation rates of the
compounds, for details see Ref. 26). The corresponding risk func-
tions are shown in Supplementary Table S1 online. Except for ethanol and nicotine, for which certain distributions could be fitted to
the data for the European countries, uniform probability distribu-
tions were chosen in all other cases as only minimum/maximum
prevalence values for Europe in total were available. The detailed
calculation formulae chosen for probabilistic risk assessment are
shown in Supplementary Table S2 online.
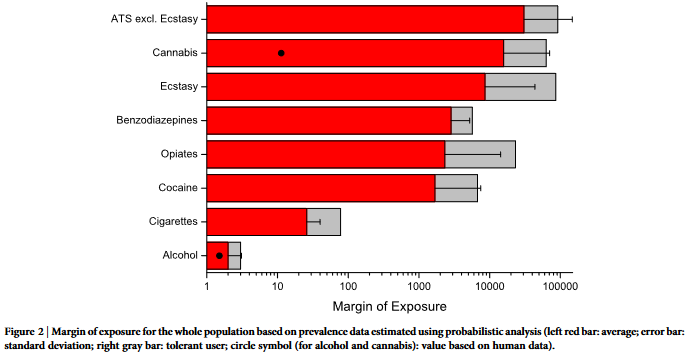
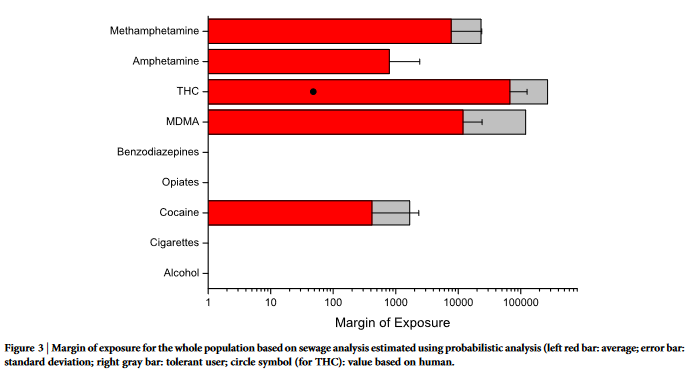
The margin of exposure values were calculated for individual
exposure (Figure 1), population-based exposure calculated from pre-
valence data (Figure 2) and population-based exposure calculated
from sewage analysis (Figure 3). The full numerical results of the
MOE distributions are presented in Supplementary Table S3 online.
For both individual and population-based scenarios, alcohol con-
sumption was found to have the lowest margin of exposure. For
individual exposure, heroin has the second lowest margin of expo-
sure. However, considering worst-case scenarios (e.g. 5th percentile),
heroin may have a lower MOE than alcohol (compare standard
deviation bars in Figure 1). On the other end of the scale, THC or cannabis can be consistently found to have high MOE values, as well
as amphetamine-type stimulants and benzodiazepines. Cocaine and
nicotine/tobacco were found to have intermediary MOE values.
For sensitivity analysis, three different methods were applied: con-
vergence testing during the probabilistic simulation, application of a
factor to consider drug tolerance, and comparison with human tox-
icological thresholds for some of the agents.
Convergence was achieved for all calculated output MOE values.
This means that the generated output distributions are stable and
reliable. The estimated means change less than 5% as additional
iterations are run during the simulation. From the model input vari-
ables, the highest influence (as expressed by rank of regression coef-
ficients) on the results is caused by the exposure, rather than the
toxicological thresholds or the bodyweights.
The sensitivity analysis data for tolerant users are additionally
shown in Figure 1–3 based on the ratio between no-tolerance and
high tolerance dosage as shown in Table 2 27,37,42–54 . Even though the
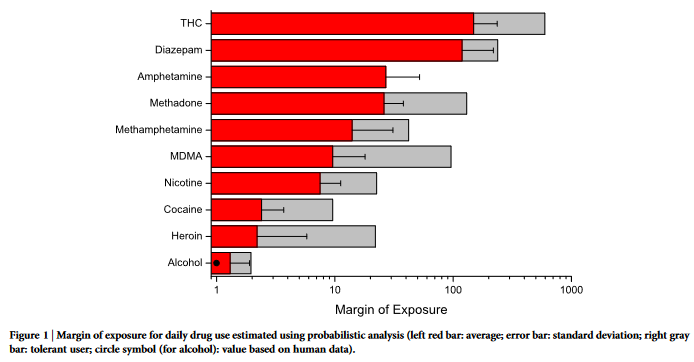
general results remain stable (i.e. especially alcohol at the top posi-
tion), the ranks between opiates and cocaine change due to the high
tolerance to extreme dosages that was reported for opiates. However,
as the percentage of tolerant users is generally unknown, the most
probable value of MOE would lie in the range between non-tolerant
and tolerant users (the gray-marked area in Figures 1–3).
Finally, the sensitivity analysis results from application of human
toxicity data for some of the compounds (alcohol, nicotine and
THC21,55–57
) are shown in Supplementary Table S3 online and marked
in Figures 1–3. For alcohol, the human MOE results correspond
closely to the ones calculated from animal LD50. For the other com-
pounds, a discrepancy between animal and human data was detected
(see discussion). Discussion
Many governments in Europe have favoured more restrictive policies
with respect to illicit drugs than for alcohol or tobacco, on the
grounds that they regard both illicit drug abuse and related problems
as a significantly larger problem for society 58 . Drug rankings can
therefore be useful to inform policy makers and the public about
the relative importance of licit drugs (including prescription drugs)
and illicit drugs for various types of harm 58 .
Our MOE results confirm previous drug rankings based on other
approaches. Specifically, the results confirm that the risk of cannabis
may have been overestimated in the past. At least for the endpoint of
mortality, the MOE for THC/cannabis in both individual and popu-
lation-based assessments would be above safety thresholds (e.g. 100
for data based on animal experiments). In contrast, the risk of alcohol
may have been commonly underestimated.
Our results confirm the early study of Gable6 who found that the
margin of safety (defined as therapeutic index) varied dramatically
between substances. In contrast, our approach is not based on a
therapeutic index, which is not necessarily associated with risk, but
uses the most recent guidelines for risk assessment of chemical sub-
stances, which also takes the population-based exposure into account.
A major finding of our study is the result that the risk of drugs
varies extremely, so that a logarithmic scale is needed in data pre-
sentation of MOE (e.g. Figures 1–3). Therefore, we think that pre-
vious expert-based approaches which often applied a linear scale of
0–3 or 0–100 3,9 , might have led to a form of ‘‘egalitarianism’’, in
which the public health impact of drugs appears more similar than
it is in reality (i.e. more than 10.000-fold different as shown in our
results on a population basis, e.g. Fig. 2 and 3). As expected, for an
individual the difference between the impact of different drugs is not
as large as for the whole society (i.e. only up to 100 fold, Fig. 1).
According to the typical interpretation of MOEs derived from
animal experiments, for individual exposure the four substances
alcohol, nicotine, cocaine and heroin fall into the ‘‘high risk’’ category
with MOE , 10, the rest of the compounds except THC fall into the
‘‘risk’’ category with MOE , 100. On a population scale, only alcohol
would fall into the ‘‘high risk’’ category, and cigarette smoking would
fall into the ‘‘risk’’ category. A difference between individual and
whole population MOE was confirmed by the lack of correlation
between average values (linear fit: R 5 0.25, p 5 0.53). This result
is different to the previous expert-based surveys, for which the rank-
ing performed at the population and individual level generally led to
the same ranking (R 5 0.98)3 . Nevertheless, we judge our results as
more plausible. For an individual heavy consumer of either heroin or
alcohol, the risk of dying from a heroin overdose or from alcoholic
cirrhosis increased considerably in each case. However for the society
as a whole, the several ten-thousands of alcohol-related deaths con-
siderably outnumber drug overdose deaths. Hence, it is plausible that
the MOE for alcohol can be lower than the one for heroin, purely
because of the high exposure to alcohol in the European society (see
also Rehm et al. 59 ).
Nevertheless, as previously stressed, our findings should not be
interpreted that moderate alcohol consumption poses a higher risk to
an individual and their close contacts than regular heroin use 14 .
Much of the harm from drug use is not inherently related to con-
sumption, but is heavily influenced by the environmental conditions
of the drug use2 , and this additional hazard is not included in a drug
ranking based on (animal) toxicology.
The first major problem of the approach is the lack of toxicological
dose-response data for all compounds except alcohol and tobacco.
No human dose-response data are available; also no dose-response
data in animals, only LD50 values are published. Furthermore, no
chronic-toxicity data (long-term experiments) are available, which
are usually used for such kinds of risk assessment. Therefore, we can
assess only in regards to mortality but not carcinogenicity or other
long-term effects. The absence of such data is specifically relevant for
compounds with low acute toxicity (such as cannabis), the risk of
which may therefore be underestimated.
Additionally, the available toxicological thresholds (i.e. LD50
values) have considerable uncertainty (for example, more than a
factor of 10 for diazepam in different species). However it has been
previously shown that the animal LD50 is closely related to fatal drug
toxicity in humans 60 . The sensitivity analysis based on human data
for ethanol shows that the average MOE result is similar to the result
based on animal LD50. Our results for ethanol are also consistent
with previous MOE studies of ethanol 20,21
. For cannabis and nicotine,
the discrepancy in the sensitivity analysis can be explained in the
chosen endpoints (no dose response data on mortality in humans
were identifiable in the literature). For example, the only available human toxicological endpoint for cannabis as chosen by EFSA 55 was
‘‘psychotropic effects’’. The rationale for choosing this endpoint
was the exclusion of risk for the inadvertent and indirect ingestion
of THC when hemp products are used as animal feed55
. We were
unable to identify dose-response information for other endpoints of
cannabis (e.g. mental health problems, chronic risk, or other can-
nabis-constituents besides THC). We think that while it is clear that
different endpoints may yield quite different results, the human
MOE for cannabis based on the endpoint ‘‘psychotropic effects’’
can be seen as general validation of the MOE concept, because the
resulting values below 1 are expected as the psychotropic effect is the
desired endpoint (and hence the psychotropic threshold dose is
exceeded by drug users). Similar to cannabis, the sensitivity analysis
for nicotine based on human data resulted in much lower MOE
values. This again is based on a different endpoint (increase of blood
pressure in this case, which is expected to be more sensitive than
mortality). We nevertheless think that the risks of cigarettes could
have been underestimated in our modelling, because in contrast to
the other agents, tobacco contains a multicomponent mixture of
toxicants. Previous risk assessment of tobacco (both financed and
co-authored by the tobacco industry) have looked at various com-
pounds but not included nicotine itself22,23
. From the variety of
investigated compounds in tobacco smoke, the lowest MOEs were
found for hydrogen cyanide (MOE 15)22 and acrolein (MOE range
2–11)23
. These values are reasonably consistent with our MOE for
nicotine of 7.5 (individual exposure). However, it would be advisable
for future risk assessments of tobacco smoking to include modelling
of a combined MOE, which considers all toxic compounds.
The second major problem is the uncertainty in data about indi-
vidual and population-wide exposure due to the illegal markets.
There is a scarcity of epidemiological studies of cannabis use by
comparison with epidemiological studies of alcohol and tobacco
use 61 . If population data are available, they are usually provided as
‘‘% prevalence’’, but for risk assessment we need a population-wide
per-capita dosage in ‘‘mg compound/person/day’’.
Due to both problems (or in other words the large uncertainty in
input data of exposure), we cannot calculate with point estimates. To
overcome this, we are using a probabilistic calculation methodology
that takes the whole distribution of the input variables into account.
For example, for the exposure a random sample of the number of days
of annual drug use is combined with a random sample in the range of
the usual dosages of the drug to provide an estimate for dosage.
The downside of the probabilistic approach is that the output also
is not a single numerical value but rather a likelihood distribution.
Nevertheless, using graphical approaches (Figs. 1–3) the results for
all drugs under study can be quickly compared. On the other hand,
this may be an advantage, as we did not try to establish a single value
‘‘to be written in stone’’. The utility of ‘‘single figure index harm
rankings’’ has also been questioned in general62 .
Our approach contains some further limitations: Drug interac-
tions cannot be taken into account as we just do not have any tox-
icological data on such effects (e.g. by co-administration in animals).
However, polydrug use in humans is common, especially of illicit
drugs with ethanol or benzodiazepines63 . Addiction potential and
risk of use (e.g. unclean syringes leading to increased infection risk)
are also not considered by the model, because adequate dose-res-
ponse data could not be identified for these endpoints.
Aside from the limitations in data, our results should be treated
carefully particularly in regard to dissemination to lay people. For
example, tabloids have reported that ‘‘alcohol is worse than hard
drugs’’ following the publication of previous drug rankings. Such
statements taken out of context may be misinterpreted, especially
considering the differences of risks between individual and the whole
population.
A main finding of our study is the qualitative validation of pre-
vious expert-based approaches on drug-ranking (e.g. Nutt et al. 9 ), especially in regard to the positions of alcohol (highest) and cannabis
(lowest). Currently, the MOE results must be treated as preliminary
due to the high uncertainty in data. The analyses may be refined
when better dose-response data and exposure estimates become
available. As the problem is multidimensional 15 , it would also make
sense to establish some form of harm or risk matrix 64 that may be
more suitable than a single indicator. Our MOE could be one piece
in the puzzle that constitutes to the establishment of a ‘‘holistic drug
risk’’.
Currently, the MOE results point to risk management prioritiza-
tion towards alcohol and tobacco rather than illicit drugs. The high
MOE values of cannabis, which are in a low-risk range, suggest a
strict legal regulatory approach rather than the current prohibition
approach.
Methods
The methodology for comparative quantitative risk assessment was based on a pre-
vious study conducted for compounds in alcoholic beverages 20 with the exception that
probabilistic exposure estimation was conducted 65–67 . The MOE approach was used
for risk assessment 18,19 . The MOE is defined as the ratio between the lower one-sided
confidence limit of the BMD (BMDL) and estimated human intake of the same
compound. If the BMD as preferred toxicological threshold for MOE assessment is
unavailable, no observed effect levels (NOEL), no observed adverse effect levels
(NOAEL) or lowest observed adverse effect levels (LOAEL) may be applied. As none
of these thresholds (neither human data nor animal data) was available for the illicit
drugs, LD50 values from animal experiments were selected instead and extrapolated
to BMDL. The exposure was calculated for individual scenarios of daily drug use, as
well as for population based scenarios using drug prevalence data and sewage analysis
data for Europe, which is a promising complementary approach for estimating the
drug use in the general population.
The MOE was calculated using the software package @Risk for Excel Version 5.5.0
(Palisade Corporation, Ithaca, NY, USA). Monte Carlo simulations were performed
with 100,000 iterations using Latin Hypercube sampling and Mersenne Twister
random number generator. Convergence was tested with a tolerance of 5% and a
confidence level of 95%. The distribution functions and detailed calculation meth-
odology is specified in Supplementary Tables S1–S2 online.
1. Coomber, R. Assessing the real dangers of illicit drugs - Risk analysis as the way
forward? Addict. Res. 7, 85–90 (1999).
2. Fischer, B., Kendall, P., Rehm, J. & Room, R. Charting WHO-goals for licit and
illicit drugs for the year 2000: are we ‘on track’? Public Health 111, 271–275
(1997).
3. van Amsterdam, J., Opperhuizen, A., Koeter, M. & van den Brink, W. Ranking the
harm of alcohol, tobacco and illicit drugs for the individual and the population.
Eur. Addict. Res. 16, 202–207 (2010).
4. UNODC. Towards the Creation of an Illicit Drug Index. World drug report 2005.
Volume 1: Analysis [165–174] (United Nations Office on Drugs and Crime,
Vienna, Austria, 2005).
5. King, L. A. & Corkery, J. M. An index of fatal toxicity for drugs of misuse. Hum.
Psychopharmacol. 25, 162–166 (2010).
6. Gable, R. S. Toward a comparative overview of dependence potential and acute
toxicity of psychoactive substances used nonmedically. Am. J. Drug Alcohol Abuse
19, 263–281 (1993).
7. Gable, R. S. Comparison of acute lethal toxicity of commonly abused psychoactive
substances. Addiction 99, 686–696 (2004).
8. Nutt, D., King, L. A., Saulsbury, W. & Blakemore, C. Development of a rational
scale to assess the harm of drugs of potential misuse. Lancet 369, 1047–1053
(2007).
9. Nutt, D. J., King, L. A. & Phillips, L. D. Drug harms in the UK: a multicriteria
decision analysis. Lancet 376, 1558–1565 (2010).
10. Morgan, C. J., Noronha, L. A., Muetzelfeldt, M., Fielding, A. & Curran, H. V.
Harms and benefits associated with psychoactive drugs: findings of an
international survey of active drug users. J. Psychopharmacol. 27, 497–506 (2013).
11. Morgan, C. J., Muetzelfeldt, L., Muetzelfeldt, M., Nutt, D. J. & Curran, H. V.
Harms associated with psychoactive substances: findings of the UK National
Drug Survey. J. Psychopharmacol. 24, 147–153 (2010).
12. Carhart-Harris, R. L. & Nutt, D. J. User perceptions of the benefits and harms of
hallucinogenic drug use: A web-based questionnaire study. J. Substance Use 15,
283–300 (2010).
13. Kalant, H. Drug classification: science, politics, both or neither? Addiction 105,
1146–1149 (2010).
14. Claridge, L. C. Drugs and harm to society. Lancet 377, 552 (2011).
15. Caulkins, J. P., Reuter, P. & Coulson, C. Basing drug scheduling decisions on
scientific ranking of harmfulness: false promise from false premises. Addiction
106, 1886–1890 (2011).
16. IPCS. IPCS Risk Assessment Terminology (World Health Organization, Geneva,
2004)
17. Crump, K. S. A new method for determining allowable daily intakes. Fundam.
Appl. Toxicol. 4, 854–871 (1984).
18. U.S.EPA. The use of the benchmark dose approach in health risk assessment. EPA/
630/R-94/007 (Office of Research and Development. US Environmental
Protection Agency, Washington, DC, 1995).
19. EFSA. Opinion of the Scientific Committee on a request from EFSA related to a
harmonised approach for risk assessment of substances which are both genotoxic
and carcinogenic. EFSA J. 282, 1–31 (2005).
20. Lachenmeier, D. W., Przybylski, M. C. & Rehm, J. Comparative risk assessment of
carcinogens in alcoholic beverages using the margin of exposure approach. Int. J.
Cancer 131, E995–E1003 (2012).
21. Lachenmeier, D. W., Kanteres, F. & Rehm, J. Epidemiology-based risk assessment
using the benchmark dose/margin of exposure approach: the example of ethanol
and liver cirrhosis. Int. J. Epidemiol. 40, 210–218 (2011).
22. Xie, J. et al. A probabilistic risk assessment approach used to prioritize chemical
constituents in mainstream smoke of cigarettes sold in China. Regul. Toxicol.
Pharmacol. 62, 355–362 (2012).
23. Cunningham, F. H., Fiebelkorn, S., Johnson, M. & Meredith, C. A novel
application of the Margin of Exposure approach: Segregation of tobacco smoke
toxicants. Food Chem. Toxicol. 49, 2921–2933 (2011).
24. Shulgin, A. T. The background and chemistry of MDMA. J. Psychoactive Drugs 18,
291–304 (1986).
25. Gold, L. S., Gaylor, D. W. & Slone, T. H. Comparison of cancer risk estimates
based on a variety of risk assessment methodologies. Regul. Toxicol. Pharmacol.
37, 45–53 (2003).
26. Thomas, K. V. et al. Comparing illicit drug use in 19 European cities through
sewage analysis. Sci. Total Environ. 432, 432–439 (2012).
27. Erowid. Notes on heroin dosage and tolerance (http://www.erowid.org/chemicals/
heroin/heroin_dose1.shtml, (2001), Date of access: 2014/04/13).
28. UNODC. World Drug Report 2013 (United Nations Office on Drugs and Crime,
Vienna, Austria, 2013).
29. Musshoff, F., Lachenmeier, D. W. & Madea, B. Cocain Und Cocainmetaboliten.
Haaranalytik-Technik und Interpretation in Medizin und Recht [Madea, B. &
Musshoff, F. (eds.)] [163–178] (Deutscher A ̈ rzte-Verlag, Cologne, Germany,
2004).
30. Musshoff, F., Lachenmeier, D. W. & Madea, B. Cannabinoide. Haaranalytik-
Technik und Interpretation in Medizin und Recht [Madea, B. & Musshoff, F.
(eds.)] [179–188] (Deutscher A ̈ rzte-Verlag, Cologne, Germany, 2004).
31. Hunault, C. C. et al. Delta-9-tetrahydrocannabinol (THC) serum concentrations
and pharmacological effects in males after smoking a combination of tobacco and
cannabis containing up to 69 mg THC. Psychopharmacol. (Berl.) 201, 171–181
(2008).
32. Land, T. et al. Recent increases in efficiency in cigarette nicotine delivery:
Implications for tobacco control. Nicotine Tob. Res. 16, 753–758 (2014).
33. OECD. OECD.Stat Extracts. Non-Medical Determinants of Health. MetaData.
Tobacco consumption. http://stats.oecd.org/index.aspx?queryid530127, (2014),
Date of access: 2014/04/13.
34. WHO. Global Health Observatory Data Repository. Tobacco control. Monitor:
Prevalence - adult age-standardized. Data by country (World Health
Organization, Geneva, Switzerland. http://apps.who.int/gho/data/node.main.
1250?lang5en, (2014), Date of access: 2014-04-24).
35. Leavitt, S. B. Methadone dosing & safety in the treatment of opioid addiction.
Addiction Treatment Forum 12, 1–8 (2003).
36. Musshoff, F., Lachenmeier, D. W. & Madea, B. Amphetamine. Haaranalytik-
Technik und Interpretation in Medizin und Recht [Madea, B. & Musshoff, F.
(eds.)] [189–205] (Deutscher A ̈ rzte-Verlag, Cologne, Germany, 2004).
37. Erowid. Methamphetamine dosage (http://www.erowid.org/chemicals/meth/
meth_dose.shtml, (2003), Date of access: 2014/04/23).
38. NHTSA. Drugs and human performance fact sheets.
Methylenedioxymethamphetamine (MDMA, Ecstasy) (http://www.nhtsa.gov/
people/injury/research/job185drugs/methylenedioxymethamphetamine.htm,
(2014), Date of access: 2014/04/23).
39. NHTSA. Drugs and human performance fact sheets. Diazepam (http://www.nhtsa.
gov/people/injury/research/job185drugs/diazepam.htm, (2014), Date of access:
2014/04/23).
40. EMCDDA. Benzodiazepines. European Monitoring Centre for Drugs and Drug
Addiction (http://www.emcdda.europa.eu/publications/drug-profiles/
benzodiazepine, (2013), Date of access: 2014/04/24).
41. WHO. Global status report on alcohol and health - 2014 ed. (World Health
Organization, Geneva, Switzerland, 2014).
42. EMCDDA. Cocaine and crack. European Monitoring Centre for Drugs and Drug
Addiction (http://www.emcdda.europa.eu/publications/drug-profiles/cocaine,
(2013), Date of access: 2014/06/12).
43. Jones, R. T., Benowitz, N. L. & Herning, R. I. Clinical relevance of cannabis
tolerance and dependence. J. Clin. Pharmacol. 21, 143S–152S (1981).
44. Haney, M., Ward, A. S., Comer, S. D., Foltin, R. W. & Fischman, M. W. Abstinence
symptoms following oral THC administration to humans. Psychopharmacology
(Berl.) 141, 385–394 (1999).
45. Mayer, B. How much nicotine kills a human? Tracing back the generally accepted
lethal dose to dubious self-experiments in the nineteenth century. Arch. Toxicol.
88, 5–7 (2014).
46. Stolerman, I. P., Bunker, P. & Jarvik, M. E. Nicotine tolerance in rats; role of dose
and dose interval. Psychopharmacologia (Berl.) 34, 317–324 (1974).
47. Minion, G. E., Slovis, C. M. & Boutiette, L. Severe alcohol intoxication: a study of
204 consecutive patients. J. Toxicol. Clin. Toxicol. 27, 375–384 (1989).
48. Vonghia, L. et al. Acute alcohol intoxication. Eur. J. Intern. Med. 19, 561–567
(2008).
49. Farrell, M. et al. Methadone maintenance treatment in opiate dependence: a
review. BMJ 309, 997–1001 (1994).
50. Modesto-Lowe, V., Brooks, D. & Petry, N. Methadone deaths: risk factors in pain
and addicted populations. J. Gen. Intern. Med. 25, 305–309 (2010).
51. Musshoff, F., Lachenmeier, K., Lachenmeier, D. W., Wollersen, H. & Madea, B.
Dose-concentration relationships of methadone and EDDP in hair of patients on
a methadone-maintenance program. Forensic Sci. Med. Pathol. 1, 97–103 (2005).
52. Parrott, A. C. Chronic tolerance to recreational MDMA (3,4-
methylenedioxymethamphetamine) or Ecstasy. J. Psychopharmacol. 19, 71–83
(2005).
53. Schifano, F. A bitter pill. Overview of ecstasy (MDMA, MDA) related fatalities.
Psychopharmacology (Berl.) 173, 242–248 (2004).
54. Cook, P. J., Flanagan, R. & James, I. M. Diazepam tolerance: effect of age, regular
sedation, and alcohol. Br. Med. J. (Clin. Res. Ed.) 289, 351–353 (1984).
55. EFSA. Scientific opinion on the safety of hemp (Cannabis genus) for use as animal
feed. EFSA J. 9, 2011 (2011).
56. EFSA. Potential risks for public health due to the presence of nicotine in wild
mushrooms. EFSA J. RN-286, 1–47 (2009).
57. Lindgren, M., Molander, L., Verbaan, C., Lunell, E. & Rosen, I.
Electroencephalographic effects of intravenous nicotine–a dose-response study.
Psychopharmacol. (Berl.) 145, 342–350 (1999).
58. Rossow, I. Can harm ratings be useful? Addiction 106, 1893–1894 (2011).
59. Rehm, J., Lachenmeier, D. W. & Room, R. Why does society accept a higher risk
for alcohol than for other voluntary or involuntary risks? BMC Med. 12, 189
(2014).
60. King, L. A. & Moffat, A. C. A possible index of fatal drug toxicity in humans. Med.
Sci. Law. 23, 193–198 (1983).
61. Hall, W., Room, R. & Bondy, S. Comparing the Health and Psychological Risks of
Alcohol, Cannabis, Nicotine and Opiate Use. The Health Effects of Cannabis
[Kalant, H., Corrigal, W., Hall, W. & Smart, R. (eds.)] [477-506] (Addiction
Research Foundation, Toronto, , Canada, 1999).
62. Rolles, S. & Measham, F. Questioning the method and utility of ranking drug
harms in drug policy. Int. J. Drug Policy 22, 243–246 (2011).
63. Musshoff, F., Lachenmeier, D. W. & Madea, B. Methadone substitution:
medicolegal problems in Germany. Forensic Sci. Int. 133, 118–124 (2003).
64. Fischer, B. & Kendall, P. Nutt et al.’s harm scales for drugs–room for improvement
but better policy based on science with limitations than no science at all. Addiction
106, 1891–1892 (2011).
65. Lachenmeier, D. W. & Rehm, J. Unrecorded Alcohol - No Worries Besides
Ethanol: a Population-Based Probabilistic Risk Assessment. Alcohol policy in
Europe: Evidence from AMPHORA. 2nd ed. [Anderson, P., Braddick, F., Reynolds J. & Gual, A. (eds.)] [118–130] (Alcohol Measures for Public Health Research
Alliance (AMPHORA), Barcelona, Spain, 2013).
66. Lachenmeier, D. W., Godelmann, R., Witt, B., Riedel, K. & Rehm, J. Can
resveratrol in wine protect against the carcinogenicity of ethanol? A probabilistic
dose-response assessment. Int. J. Cancer 134, 144–153 (2014).
67. Lachenmeier, D. W. et al. Caffeine intake from beverages in German children,
adolescents, and adults. J. Caffeine Res. 3, 47–53 (2013).
Acknowledgments
The research leading to these results or outcomes has received funding from the European
Community’s Seventh Framework Programme (FP7/2007–2013), under Grant Agreement
nu 266813 - Addictions and Lifestyle in Contemporary Europe – Reframing Addictions
Project (ALICE RAP – www.alicerap.eu). Participant organisations in ALICE RAP can be
seen at http://www.alicerap.eu/about-alice-rap/partner-institutions.html. The views
expressed here reflect only the author’s and the European Union is not liable for any use that
may be made of the information contained therein. Support to CAMH for the salaries of
scientists and infrastructure has been provided by the Ontario Ministry of Health and Long
Term Care. The contents of this paper are solely the responsibility of the authors and do not
necessarily represent the official views of the Ministry of Health and Long Term Care or of
other funders.
Author contributions
D.W.L. conceived of the study, conceptualized the data analyses and performed the
calculations. J.R. collected the data from WHO and provided additional data for sensitivity
analysis. All authors have been involved in the drafting of the article and the interpretation
of the data and in critical revisions of the content. All authors have given final approval of
the version to be published.
Additional information
Supplementary information accompanies this paper at http://www.nature.com/
scientificreports
Competing financial interests: The authors declare no competing financial interests.
How to cite this article: Lachenmeier, D.W., & Rehm, J. Comparative risk assessment of
alcohol, tobacco, cannabis and other illicit drugs using the margin of exposure approach.
Sci. Rep. 5, 8126; DOI:10.1038/srep08126 (2015)