
Study Links Medical Marijuana to Fewer Traffic Fatalities
US Traffic Fatalities, 1985–2014, and Their Relationship to Medical Marijuana Laws
Objectives. To determine the association of medical marijuana laws (MMLs) with traffic fatality rates. Methods. Using data from the 1985–2014 Fatality Analysis Reporting System, we examined the association between MMLs and traffic fatalities in multilevel regression models while controlling for contemporaneous secular trends. We examined this association separately for each state enacting MMLs. We also evaluated the association between marijuana dispensaries and traffic fatalities.
Results. On average, MML states had lower traffic fatality rates than non-MML states. Medical marijuana laws were associated with immediate reductions in traffic fatalities in those aged 15 to 24 and 25 to 44 years, and with additional yearly gradual reductions in those aged 25 to 44 years. However, state-specific results showed that only 7 states experienced post-MML reductions. Dispensaries were also associated with traffic fatality reductions in those aged 25 to 44 years.
Conclusions. Both MMLs and dispensaries were associated with reductions in traffic fatalities, especially among those aged 25 to 44 years. State-specific analysis showed heterogeneity of the MML–traffic fatalities association, suggesting moderation by other local factors. These findings could influence policy decisions on the enactment or repealing of MMLs and how they are implemented. (Am J Public Health. Published online ahead of print December 20, 2016: e1–e7. doi:10.2105/AJPH.2016.303577)
In the past 2 decades, 23 US states and the District of Columbia have enacted laws allowing the use of cannabis (marijuana) to treat certain medical conditions.1 Despite potential benefits of legislation protecting the medical use of marijuana, concern is
increasing that medical marijuana laws (MMLs) may increase nonmedical marijuana use and the number of individuals driving
under the influence of marijuana, and thus increase the rate of traffic injuries.2
Some simulator and on-road experimental studies show a dose-dependent association between marijuana exposure and several indicators of driving impairment.3 Studies show that marijuana exposure is associated with increased response time and lane weaving.4,5 In addition, it has been associated with impairment in other complex tasks requiring neurocognitive and neuromotor skills6,7 that are likely to be involved in driving safely. Marijuana exposure has also been associated with reduced speed and greater headway,4,8 which indicates some degree of awareness of marijuana-related impairment and a tendency to compensate.8
Despite these observations, population based data have not shown an increase in traffic fatalities following medical marijuana legalization. A study that used 1990–2010 Fatality Analysis Reporting System (FARS) data showed that, contrary to expectations, MML enactment was associated with a reduction in the rates of traffic fatalities in the overall population (10.4% reduction), mainly because of a reduction in alcohol-related traffic fatalities.9 These findings suggest that MML enactment could have contributed to an increase in marijuana use and lowered the use of alcohol, consistent with the substitution hypothesis,10 in these states, partially explaining the reduced alcohol-related incidents observed.
Previous research11 also shows that MMLs are heterogeneous across states, and that certain aspects of these laws, such as allowances on home cultivation or dispensaries, might be important to take into account when one is assessing the association between MMLs and different health outcomes. For example, a previous study showed that authorization of dispensaries in MML states was associated with treatment admissions in which marijuana is the primary substance of abuse.11 One study to date has found evidence of dispensary legal provisions in MML states to be associated with an increase in traffic fatalities,12 but the study did not examine the association between the actual presence of operational dispensaries (i.e., having an operating dispensary system even if not officially sanctioned) and traffic fatalities. Examining the role of operational dispensaries would provide additional information on whether increases in marijuana availability via dispensaries lead to changes in fatality rates.
We investigated the association between MML enactment and change in traffic fatalities, making use of a wider range of the FARS data, years 1985 to 2014, and including 9additional states enacting MMLs between 2010 and 2014. We examined whether the
rate of traffic fatalities changed following MML enactment in 1985 to 2014, if the magnitude of the association differed by state, and if estimates were robust to different model specifications and to the inclusion of potential confounders in the model. In addition, we explored the specific role of operational medical marijuana dispensaries on traffic fatality rates.
METHODS
Data came from the FARS, a nationwide census of traffic fatalities information maintained by the National Highway Traffic Safety Administration. Briefly, this data set provides data on individuals fatally injured in motor vehicle crashes on public
roads in the United States who died within 30 days of the crash.13 Data include driver characteristics such as age, gender, and race. We obtained the aggregated FARS data from different sources including police accident reports, death certificates, coroner or medical examiner reports, hospital medical reports, state highway department data, emergency medical services records, vital statistics, and other state records.13 Trained analysts collected the data by using standardized protocols that automatically check for acceptable range values and consistency.13 We used FARS data from years 1985 to 2014, enabling us to include at least 10 years of pre-MML data for all states enacting these laws. We did not include the District of Columbia in the analyses.
Measures
Traffic fatalities. Our outcome of interest was the rate of traffic fatalities across time. We obtained the total number of fatally injured road users, including drivers, passengers, cyclists, and pedestrians, by year, state, and age group (entire population, and those aged 15–24, 25–44, and ‡45 years) from FARS. We obtained state populations for each year, state, and age group used to calculate fatality rates for each state from the Web-based Injury Statistics Query and Reporting System of the Centers for Disease Control and Prevention.14 In analyses for the entire population, we used age-adjusted traffic fatality rates based on the 2000 US population.
Enactment and effective date of medical marijuana laws.
Our main exposure was the enactment of MMLs by state, as defined by legal scholars, economists, and policy analysts at RAND Corporation15 (Table A, available as a supplement to the online version of this article at http://www.ajph.org). First,
we coded the MML variable as a time-varying (i.e., allowed to change over time), 3-category variable. The 3 categories were before, after, and never. States enacting medical marijuana laws were coded as “before” for the years before the enactment of the laws, and as “after” for years after. For example, because Vermont enacted its MML in 2004, this state is coded as “before”for years 1985 to 2003 and as “after” for years 2004 to 2014. As MMLs are enacted in different months, if the law was enacted between January 1 and June 30, we coded the year of MML enactment as “after,” because the state was exposed to the MML for at least half of the year in which it was enacted. Alternatively, if the MML was enacted between July 1 and December 31, we coded the year of MML enactment as “before,” because the state was exposed to the MML only for the
second half of the year. States without MMLs up to 2014 were coded as “never”for all years.
We also used the date when MMLs became effective, when the statutory obligation commences in each state, rather than the date enacted. We used the same coding strategy as the one used for enactment dates.
Operational dispensaries.
We coded the presence of operational dispensaries in MML states as a time-varying, 3-category variable in a similar way as we did for our MML variable—before, after, and never—on the basis of previous11,16 and recent information provided by researchers at RAND Corporation. States with MMLs were coded as “before”for years before they had operational dispensaries, and were coded as “after” for years when the state had legally operating dispensaries. This is when
legislation was passed allowing marijuana sales and also an operational regulatory and distribution regime,16 or if the state had a functional dispensary system, even if not officially sanctioned16 (Table A). States without dispensaries were coded as “never” for all years.
Covariates.
We adjusted our analyses for time-varying state characteristics and state legislation used in previous research.9 State-level covariates included unemployment rate and median household income, speed limits of 70 miles per hour or greater,17 primary seat belt laws enforcement, laws decriminalizing the possession of small amounts of marijuana, and whether states had enacted a recreational marijuana law.18,19 The later 4 covariates were coded as “1” if the state had the law in any given year and “0” otherwise. We also controlled for state-level graduated driver license laws,20 blood alcohol content laws (0.08 g/dL), drug per se laws,21 administrative license revocation laws,22 and laws banning cell phone use and texting while driving, separately targeting adolescents and adults.23 These later 5 covariates were coded as “1” if the state had the law in any given year and “0” otherwise; also, if the enactment of the law occurred during a calendar year, we coded that year as the proportion of the year the law was in effect. In addition, we included a measure of state annual expenditures for highway law enforcement and safety per capita (adjusted to 2000 dollars), and also a state measure of the annual vehicle miles driven per licensed driver (thousands of miles) from Highway Statistics, US Department of Transportation (both covariates log transformed).
Because alcohol consumption can be a confounder of the association between MML and traffic fatalities, we also explored the robustness of estimates when we controlled for a measure of the state-level per capita ethanol sales, total ethanol of all beverages combined per population aged 21 years or older (log transformed) from the Surveillance Reports of the National Institute on Alcohol Abuse and Alcoholism. Results are presented in Table B, available as a supplement to the online version of this article at http://www.ajph.org. However, because changes in ethanol sales could be a mechanism through which MML influences traffic fatalities, all results provided, except when indicated, are from models not including this covariate.
Statistical Analyses
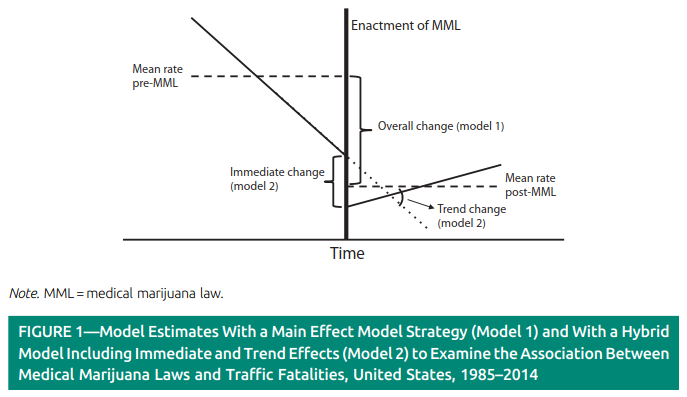
To examine whether MMLs were associated with changes in the natural logarithm of the rate of traffic fatalities, we used linear multilevel regression models24 with state-level random intercepts. This main effect model, which used the 3-category MML as the exposure variable, allowed us to determine the change in the rate of fatalities within states before and after MML enactment (Figure 1: overall change, model 1) while taking into account the rates in states that did not enact MMLs. In addition, we used a piecewise cubic spline25 with a knot at 2007 to control for the nonlinearity of national trends in traffic fatality rates; this allowed us to control for any national events that could have influenced traffic fatality rates across states over time. All models were stratified by age group, weighted by the state population, and adjusted for covariates. The percent change in fatality rates associated with the enactment of MMLs was estimated with the equation,
(1) % change = (1—exp[estimate difference between pre/post MML rates]) · 100%.
To estimate the yearly variation in the rates of traffic fatalities after the enactment of MMLs, we used an alternative model strategy by including linear trends for years before and after the enactment of MML for states with these laws.26 In this “hybrid” model, the estimate for the 3-category MML variable represents the “immediate” change in the rate soon after MMLs are enacted, and the “trend” effect represents the change in the linear trend, from the pre-MML to the post-MML period26 (Figure 1). The hybrid model can be useful to identify a change in the trend in cases such as the one presented in Figure 1, when a marked decreasing trend in traffic fatalities in the pre-MML period is followed by an immediate reduction and
then by a gradual increasing trend in traffic fatalities in the post-MML period. In this scenario, the main effect model would show an overall reduction in traffic fatalities associated with MML despite the change in the trend. The pattern in Figure 1 could emerge if, for example, the enactment of MML is followed by stronger police enforcement soon after the enactment that would result in an immediate reduction in traffic fatality rates; however, a possible gradual increase in the prevalence of marijuana use after enactment of MMLs could result in a gradually increasing prevalence of driving while intoxicated, leading to a gradual increase in traffic fatalities.
We also examined the association betweeno perational dispensaries and traffic fatalities by using similar models as described previously adjusted by covariates and also by the time- variant MML variable indicating whether states had or had not enacted MMLs.
Finally, we examined the state-specific association between MMLs and traffic fatalities in the entire population (i.e., all ages) by including state as a fixed effect in models, both in the main effect and hybrid models, with interaction terms (1) between MML and states, and (2) between prepost-MML trends and states; in this model we dichotomized the MML variable as “1”in years in which states had a MML, and “0”otherwise. This provided us the before–after comparison and the change in trends separately for each state that passed MMLs. We performed statistical analysis with SAS version 9.4 (SAS Institute Inc, Cary, NC).
RESULTS
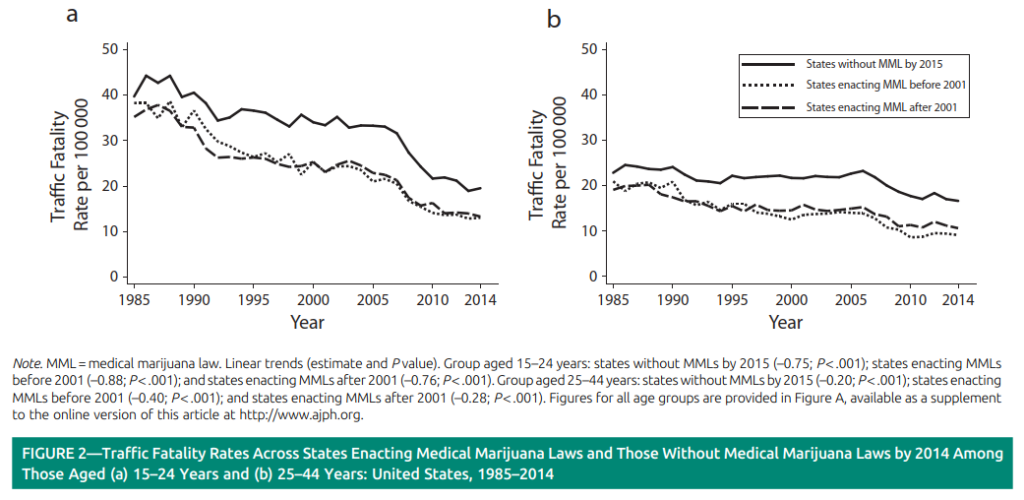
A total of 1 220 610 deaths attributable o traffic crashes occurred in the 50 states during the study period (1985–2014). We observed a reduction in the age-adjusted (2000 US population) national rate of traffic fatalities from 1985 (17.8 per 100 000) to 2014 (10.0 per 100 000). Although, on average, states enacting MMLs had lower rates of traffic fatalities compared with states without MMLs (26.3% lower; 95% confidence interval [CI] = 13.9%, 36.9%) states with and without MMLs followed a similar trend pattern toward reductions in traffic fatality rates (Figure 2). Among individuals aged 24 to 44 years, the trend for states enacting MMLs before 2001 slightly deviated during 1996 to 2000, the period in which these states enacted their MMLs, from
that of states enacting MMLs after 2001.
Medical Marijuana Law Enactment and Traffic Fatality Rates
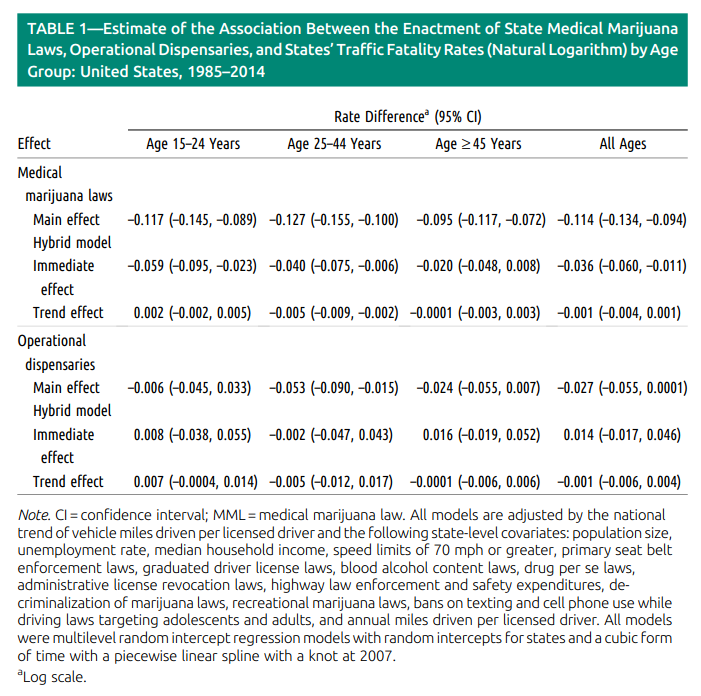
Results from main effect models for the entire population (i.e., all ages) showed that, among states passing MMLs, the mean traffic fatality rate in the pre-MML period (12.1 per 100 000) was significantly higher than that in the post-MML period (11.2 per
100 000), indicating a reduction of 10.8% (95% CI = 9.0%, 12.5%; % reduction = [1 – exp(–0.114)] · 100) in traffic fatality rates (Table 1). Similarly, we observed a reduction of 11.0% (95% CI = 8.5%, 13.5%), 12.0% (95% CI = 9.5%, 14.3%), and 9.0% (95%
CI = 6.9%, 11.0%) among those aged 15 to 24 years, 25 to 44 years, and 45 years and older, respectively (Table 1).
In hybrid models for the entire population, the immediate effect (i.e., sudden change in fatality rate after MML enactment), indicated that there was an immediate reduction of 3.5% (95% CI = 1.1%, 5.8%), whereas the gradual effect (i.e., change in rate trend after MML enactment) was not significant (Table 1). For those aged 15 to 24 and 25 to 44 years,
there were also similar immediate reductions in traffic fatalities as those observed in the entire population. Among those aged 25 to 44 years, the gradual effect was also negative and significant (difference in pre–post MML trends = –0.005; P <.01). We observed no significant reductions among those aged 45 years or older in hybrid models (Table 1).
Operational Dispensaries and Traffic Fatality Rates
Results from main effect models showed that dispensaries were associated with a significant reduction in traffic fatalities in those aged 25 to 44 years (5.1%; 95% CI = 1.5%, 8.6%), and a nonsignificant reduction in the entire population (2.7%; 95% CI = –0.01%, 5.3%; Table 1). In hybrid models, the immediate effect and gradual effects were not signi��cant for any of the age groups (Table 1).
In the main effect models, further control for the state-level per-capita ethanol sales (log transformed) covariate reduced the
magnitude of the association between MMLs and traffic fatalities by 20% to 22% across age groups, although estimates remained significant at a 95% confidence level (Table B). Hybrid models were not impacted by the inclusion of this ethanol sales covariate.
Results for the association between “MML effective date” variable and traffic fatality rates were almost identical to those
described previously for the “MML enactment date”variable (Table C, available as a supplement to the online version of this
article at http://www.ajph.org).
Estimates for Individual States
Results from the main effect model show that in 7 states (California, Oregon, Washington, Colorado, Nevada, New Mexico, and Arizona) the MML enactment was significantly associated with a reduction in traffic fatality rates, whereas in 2 states (Rhode Island and Connecticut) MMLs were associated with an increase in rates (Table 2).
In hybrid models, only 4 states showed significant associations: California showed an immediate post-MML reduction of 16.0% in traffic fatalities (95% CI = 12.0%, 20.0%) followed by a gradual yearly increase (difference in pre–post-MML trends = 0.013;
P <.01); similarly, New Mexico had an immediate post-MML reduction of 17.5% (95% CI = 1.4%, 31.0%) and significant post-MML gradual increase in traffic fatalities (difference in pre–post-MML trends = 0.049; P <.01); Colorado had a nonsignificant immediate increase and a yearly significant reduction in fatality rates (difference in pre–post-MML trends = –0.022; P <.05); and Michigan had a positive immediate increase of 14.2% in traffic fatalities (95% CI = 4.7%, 24.5%) and a nonsignificant trend effect (Table 2).
DISCUSSION
Using population-based data from 1985 to 2014, we found that, first, states that enacted MMLs during the study period had
lower fatality rates compared with states without MMLs. Second, on average, traffic fatalities further decreased in states post-MML, with both immediate (sudden change in fatality rate after MML enactment) and gradual (change in rate trend after MML
enactment) declines over time in those aged 25 to 44 years. Third, the association between MML and traffic fatalities varied considerably across states. Fourth, the presence of operational dispensaries was also associated with reductions in traffic fatalities in those aged 25 to 44 years.
We found that, on average during the study period, MML states had lower traffic fatality rates than non-MML states. It is possible that this is related to lower levels of alcohol-impaired driving behavior in MML states. Evidence from the Behavioral Risk Factor Surveillance Systems data from 200027 and 201228 shows that states that have enacted MMLs, compared with non-MML states, had, on average, lower proportions or rates of drivers endorsing having driven after having too much to drink. In addition, other unmeasured characteristics, including strength of public health laws related to driving, infrastructure characteristics (e.g., high-technology roads), or quality of health care systems, may partially explain these findings.
Our study also shows that, on average, MMLs were associated with an overall reduction in traffic fatalities in main effect models. In addition, in hybrid models, we found immediate and gradual reductions only among those aged 25 to 44 years,
a group representing a great percentage of all registered patients for medical marijuana use,29 and a group showing increases in the prevalence of marijuana use in association with the enactment of MMLs.30 Interestingly, we did not find strong evidence suggesting reductions among those aged 45 years and older, which is also a group overrepresented in the population of patients registered in state medical marijuana programs.29 This suggests that the mechanisms by which MMLs reduce traffic fatalities mostly operate in those younger adults, a group also frequently involved in alcohol-related traffic fatalities; in 2004 and 2013, 47% of fatally injured drivers with a blood alcohol content of 0.08 or greater were aged 25 to 44 years.31
There may be different mechanisms by which MMLs may reduce traffic fatalities. Some evidence suggests9 that MMLs may
increase marijuana use in the population and, consistent with the substitution hypothesis,10 reduce the prevalence of alcohol
consumption that, in turn, would result in lower rates of alcohol-related traffic fatalities. Anderson et al.9 found reductions
in traffic fatalities in which at least 1 driver was positive for any alcohol in the blood (marginally, P <.1) and those with blood
alcohol concentrations greater than or equal to 0.1 grams per deciliter (P <.05), and also reductions in traffic fatality rates occurring on weekends, which are more likely to be alcohol-related than those on weekdays.
If MMLs reduce traffic fatalities by reducing alcohol-related deaths, it is expected that these reductions would have been gradual given that MMLs are likely to gradually increase the availability of marijuana as dispensaries are opened and the
number of patients getting access to medical marijuana increases, for example, as described for patient registries across MML
states.29 However, immediate reductions may also occur if the enactment of MMLs produces rapid changes in attitudes toward marijuana use in the overall population, reducing perceptions of risk associated with marijuana use. In addition, immediate reductions can be the result of stronger preventive police enforcement actions targeting weekend drivers occurring soon after the enactment of MMLs. In this regard, because few registered patients for medical marijuana are aged 15 to 24 years29 and also because MMLs had not been found to be associated with marijuana use in individuals aged 25 years or younger30 nor in adolescents,32,33 it is possible that the immediate reduction we observed in the hybrid model for those aged 15 to 24 years is related to external control measures, such as stronger police enforcement actions.
Our findings for specific state associations suggest that not all MML states experienced reductions in traffic fatality rates, but few actually experienced increases. Although results from main effects models suggest beneficial reductions in traffic fatalities for 7 states, in the hybrid model, only Colorado showed a significant yearly reduction in traffic fatalities. In California and New
Mexico, after an initial immediate reduction, MMLs were actually associated with gradual increases in fatality rates. These findings provide evidence of the heterogeneity of MML–traffic fatalities associations across states and indicate the need for further research on the particularities of MML implementation at the local level and the interaction of MMLs with other aspects that may influence traffic fatality rates.
Finally, results from our operational dispensaries analyses, at least from the main effect model, support the initial findings that MMLs were associated with reductions in traffic fatalities among those aged 25 to 44 years and suggest that this may in part occur via increases in marijuana availability.
Limitations
Limitations are noted. First, we described an overall association between MMLs and traffic fatalities, but we are uncertain of what the causal chain may be. This study adds to evidence of the association between MMLs and traffic fatalities, laying the groundwork for future studies on specific mechanisms. Moreover, our data suggest that one mechanism is through increases in marijuana availability as dispensaries become operational. Second, because we used state-level aggregate data, we could not observe whether associations vary across different cities or counties. However, our study provides state-level estimates, the level at which MMLs are enacted. Further research at local levels will improve our understanding of how MML aspects and also other factors relate to traffic fatalities.
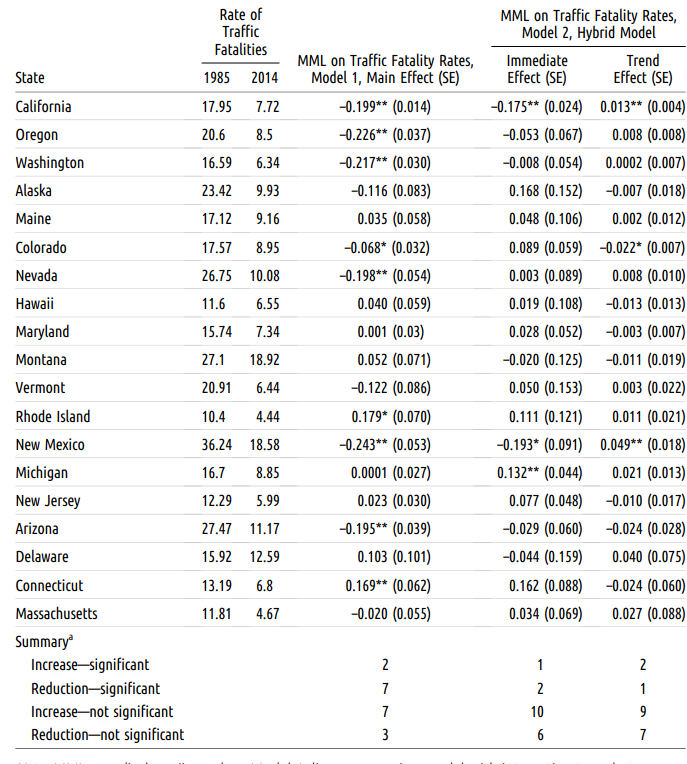
recreational marijuana laws, bans on texting and cell phone use while driving laws targeting adolescents and adults, and annual miles driven per licensed driver. aIn the summary section, significance is based on P <.05. *P <.05; **P <.01.
Third, we did not examine other variations in medical marijuana laws (e.g.,home cultivation, approved illnesses) in our models that could also have an effect on traffic fatalities. However, we examined the additional effect of operational dispensaries, an important factor increasing the availability of marijuana. Fourth, for states enacting MMLs after 2010, we had only short post-MML periods, which limited the identification of long-term effects in these states. Fifth, we could not examine whether
MMLs were associated with increments in the rates of traffic fatalities in which drivers tested positive for the presence of cannabis metabolites in blood. Testing procedures vary by state and our own exploration of FARS data showed that only a limited number of states tested 80% or more of their fatally injured drivers. In addition, the FARS coding system does not differentiate between active and inactive cannabinoid metabolites34 and, therefore, it is not possible to know whether the driver was driving under the influence of marijuana. Sixth, we used data on traffic fatalities, the most extreme injury outcome; therefore, we cannot make any observations on the association between MMLs and nonfatal traffic injuries.
Finally, our measure of per-capita alcohol consumption may not fully capture varying alcohol consumption patterns in the population, and is not informative about specific age groups. However, per-capita alcohol consumption data have moderate
to strong correlations with survey measures of drinking, heavy drinking, and binge drinking,35 and this indicator of overall
alcohol consumption in the United States has been a long-term National Institutes of Health indicator of time trends in drinking.
Implications
Our study suggests that, on average, MMLs are associated with reductions in traffic fatalities, particularly pronounced among those aged 25 to 44 years, a group representing a great percentage of all registered patients for medical marijuana use,29 and
with increased prevalence of marijuana use after the enactment of MMLs.30 Although increases in marijuana use following the establishment of marijuana dispensaries could reduce the occurrence of alcohol-related mortality by reducing the number of drivers driving under the influence of alcohol, other simultaneous factors at the state and local levels also may be responsible for these changes in traffic fatalities. Our findings show great heterogeneity of the MML–traffic fatalities
associations across states, suggesting the presence of these other mechanisms. This is important for policy development and for the debate of the enactment or repealing of MMLs, given that alternative local strategies such as stronger police enforcement and programs aiming to reduce impaired driving involving any substance use could be local factors linked to reductions in traffic fatalities in MML states.
CONTRIBUTORS
J. Santaella-Tenorio developed the design and conceptualization of the study, collected and analyzed the data under supervision of M. M. Wall and C. M. Mauro, interpreted the results, and wrote the original draft of the article. J. H. Kim, C. M. Mauro, and S. S. Martins contributed to the design and conceptualization of the study and to the interpretation of results and helped draft the article. M. M. Wall, M. Cerdá, K. M. Keyes, D. S. Hasin, and S. Galea contributed to the interpretation of results
and helped draft the article.
ACKNOWLEDGMENTS
This work was supported by the National Institutes of Health, National Institute on Drug Abuse (grant R01 DA037866toS. S. Martins, grants R01 DA034244 and T32 DA031099 to D. S. Hasin, and grant K01 DA030449 to M. Cerdá); the New York State Psychiatric Institute; and the National Institutes of Health, National Institute on Alcohol Abuse and Alcoholism (grant K01 AA021511 to K. M. Keyes). J. Santaella-Tenorio is funded by the J. William Fulbright and the Colciencias doctoral scholarships.
HUMAN PARTICIPANT PROTECTION
Ethics approval was not needed for this work because it used publically available, de-identified data.
REFERENCES
- ProCon.org. 23 legal medical marijuana states and
DC—laws, fees, and possession limits. Available at:
http://medicalmarijuana.procon.org/view.resource.php?
resourceID=000881. Accessed September 10, 2015. - Brady JE, Li G. Trends in alcohol and other drugs
detected in fatally injured drivers in the United States,
1999–2010. Am J Epidemiol. 2014;179(6):692–699. - Hartman RL, Huestis MA. Cannabis effects on driving
skills. Clin Chem. 2013;59(3):478–492. - Lenné MG, Dietze PM, Triggs TJ, et al. The effects of
cannabis and alcohol on simulated arterial driving: in-
fluences of driving experience and task demand. Accid
Anal Prev. 2010;42(3):859–866. - Ronen A, Gershon P, Drobiner H, et al. Effects of THC
- on driving performance, physiological state and subjective
- feelings relative to alcohol. Accid Anal Prev. 2008;40(3):
- 926–934.
- Ramaekers JG, Kauert G, Theunissen EL, et al. Neu-
- rocognitive performance during acute THC intoxication in
- heavy and occasional cannabis users. J Psychopharmacol. 2009;
- 23(3):266–277.
- Weinstein A, Brickner O, Lerman H, et al. A study
- investigating the acute dose–response effects of 13 mg and
- 17 mg Delta 9-tetrahydrocannabinol on cognitive-motor
- skills, subjective and autonomic measures in regular users
- of marijuana. J Psychopharmacol. 2008;22(4):441–451.
- Hartman RL, Brown TL, Milavetz G, et al. Cannabis
- effects on driving longitudinal control with and without
- alcohol. J Appl Toxicol. 2016;36(11):1418–1429.
- Anderson DM, Hansen B, Rees DI. Medical marijuana
- laws, traffic fatalities, and alcohol consumption. J Law
- Econ. 2013;56(2):333–369.
- Reiman A. Cannabis as a substitute for alcohol and
- other drugs. Harm Reduct J. 2009;6:35.
- Pacula RL, Powell D, Heaton P, et al. Assessing the
- effects of medical marijuana laws on marijuana use: the
- devil is in the details. J Policy Anal Manage. 2015;34(1):
- 7–31.
- Pacula RL, Powell D, Heaton P, et al. Assessing the
- effects of medical marijuana laws on marijuana and alcohol
- use: the devil is in the details. National Bureau of
- Economic Research. 2013. NBER Working Paper no.
- Available at: http://www.nber.org/papers/w19302.
- Accessed March 10, 2015.
- National Highway Traffic Safety Administration.
- Fatality Analysis Reporting System Analytical User’s Manual
- 1975–2013. Washington, DC: US Department of
- Transportation; 2015. DOT HS 812 092.
- Centers for Disease Control and Prevention. Web-
- based Injury Statistics Query and Reporting System
- (WISQARS). 2016. Available at: http://www.cdc.gov/
- injury/wisqars/index.html. Accessed February 20, 2016.
- Pacula RL, Boustead AE, Hunt P. Words can be
- deceiving: a review of variation among legally effective
- medical marijuana laws in the United States. J Drug Policy
- Anal. 2014;2014;7(1):1–19.
- Sevigny EL, Pacula R, Heaton P. The effects of
- medical marijuana laws on potency. Int J Drug Policy.
- 2014;25(2):308–319.
- Insurance Institute for Highway Safety, Highway
- Loss Data Institute. Speed limits [table data]. 2016.
- Available at: http://www.iihs.org/iihs/topics/laws/
- speedlimits?topicName=Speed. Accessed January 20,
- 2016.
- Scott EM. Marijuana decriminalization. Office of
- Legislative Research Report No. 2010-R-0204. Con-
- necticut General Assembly. 2010. Available at: https://
- www.cga.ct.gov/2010/rpt/2010-R-0204.htm. Accessed
- October 15, 2015.
- The Marijuana Policy Project. Available at: https://
- www.mpp.org. Accessed October 15, 2015.
- Insurance Institute for Highway Safety, Highway Loss
- Data Institute. Effective dates of graduated licensing laws,
- Available at: http://www.iihs.org/iihs/topics/laws/
- graduatedlicenseintro. Accessed September 10, 2015.
- Anderson DM, Rees DI. Per se drugged driving laws
- and traffic fatalities. Int Rev Law Econ. 2015;42:122–134.
- US Department of Transportation, National
- Highway Traffic Safety Administration. Digest of impaired driving and selected beverage control laws. DOT HS 812 119.
- McCartt AT, Kidd DG, Teoh ER. Driver cellphone
and texting bans in the United States: evidence of ef-
fectiveness. Ann Adv Automot Med. 2014;58:99–114. - Diggle PJ, Heagerty P, Liang KY, Zeger SL. Analysis
of Longitudinal Data. 2nd ed. Oxford, UK: Oxford
University Press; 2013. - de Boor C. A Practical Guide to Splines. New York, NY:
Springer-Verlag; 1978. - Ayres I, Donohue JJ. Shooting down the “more guns,
less crime” hypothesis. Stanford Law Rev. 2003;55(4):
1193–1312. - Shults RA, Sleet DA, Elder RW, et al. Association
between state level drinking and driving countermeasures
and self reported alcohol impaired driving. Inj Prev. 2002;
8(2):106–110. - Jewett A, Shults RA, Banerjee T, et al. Alcohol-
impaired driving among adults—United States, 2012.
MMWR Morbid Mortal Wkly Rep. 2015;64(30):814–817. - Fairman BJ. Trends in registered medical marijuana
participation across 13 US states and District of Columbia.
Drug Alcohol Depend. 2016;159:72–79. - Martins SS, Mauro C, Santaella-Tenorio J, et al. State-
level medical marijuana laws, marijuana use and perceived
availability of marijuana among the general U.S. pop-
ulation. Drug Alcohol Depend. 2016;169:26–32. - US Department of Transportation, National Highway
Traffic Safety Administration. Traffic safety facts 2013
data: alcohol-impaired driving. 2014. Available at: http://
www-nrd.nhtsa.dot.gov/Pubs/812102.pdf. Accessed
February 11, 2016. - Hasin DS, Wall M, Keyes KM, et al. Medical mar-
ijuana laws and adolescent marijuana use in the USA from
1991 to 2014: results from annual, repeated cross-sectional
surveys. Lancet Psychiatry. 2015;2(7):601–608. - Lynne-Landsman SD, Livingston MD, Wagenaar AC.
Effects of state medical marijuana laws on adolescent
marijuana use. Am J Public Health. 2013;103(8):
1500–1506. - Hartman RL, Huestis MA. Re: “Trends in alcohol and
other drugs detected in fatally injured drivers in the
United States, 1999–2010.”Am J Epidemiol. 2014;180(8):
862–863. - Nelson DE, Naimi TS, Brewer RD, et al. US state
alcohol sales compared to survey data, 1993–2006. Ad-
diction. 2010;105(9):1589–1596.
This article originally appeared at https://ajph.aphapublications.org/doi/full/10.2105/AJPH.2016.303577