
The current state of climate change 2022
Today I would like to take some time to lay out the current levels of green house gasses with historical data.
Let's start with the simplest to understand, CO2.
| September 2022: | 415.95 ppm |
| September 2021: | 413.30 ppm |

Which may not seem like a lot, but it is. However what has been baffling scientists is, that alone wouldn't account for the rapid onslaught of climate disasters we are seeing already, which was not supposed to even start happening until 2050.
So what could account for the vast differences between the conservative estimates and what we are experiencing ?
Well there are many factors, but the primary one has to do with the changes in the global energy system in the last decade with the introduction of fracking for natural gas, which has the chemical name of CH4 which is also commonly called methane.
The three main greenhouse gases (along with water vapour) and their 20-year global warming potential (GWP) compared to carbon dioxide are: (1)
- 1 x – carbon dioxide (CO2) NOTE: Any carbon dioxide added to the atmosphere will hang around for a long time: between 300 to 1,000 years. All this time, it will be contributing to trapping heat and warming the atmosphere.
- 84 x – methane (CH4) – I.e. Releasing 1 kg of CH4 into the atmosphere is about equivalent to releasing 84 kg of CO2. Methane’s 100-year GWP is about 28x CO2 – but it only persists in the atmosphere for a little more than a decade. The 100-year GWP is used to derive CO2e.
- 298 x – nitrous oxide (N2O) – I.e. Releasing 1 kg of N2O into the atmosphere is about equivalent to releasing about 298 kg of CO2. Nitrous oxide persists in the atmosphere for more than a century. It’s 20-year and 100-year GWP are basically the same.
Global Warming Potential (GWP) table
The following table shows the 100-year global warming potential for greenhouse gases reported by the United Nations Framework Convention on Climate Change (UNFCCC). (1)
Click here to download an expanded PDF table: GHG Lifetimes and GWPs (144 kB)
How to read this table
The column on the right shows how much that chemical would warm the earth over a 100-year period as compared to carbon dioxide.
For example, sulphur hexafluoride is used to fill tennis balls. The table shows that a release on 1 kg of this gas is equivalent to 22,800 kg or 22.8 tonnes of CO2. Therefore, releasing ONE KILOGRAM of sulphur hexafluoride is about equivalent to driving 5 cars for a year! (2)
| Greenhouse Gas | Formula | 100-year GWP (AR4) |
|---|---|---|
| Carbon dioxide | CO2 | 1 |
| Methane | CH4 | 28 |
| Nitrous oxide | N2O | 298 |
| Sulphur hexafluoride | SF6 | 22,800 |
| Hydrofluorocarbon-23 | CHF3 | 14,800 |
| Hydrofluorocarbon-32 | CH2F2 | 675 |
| Perfluoromethane | CF4 | 7,390 |
| Perfluoroethane | C2F6 | 12,200 |
| Perfluoropropane | C3F8 | 8,830 |
| Perfluorobutane | C4F10 | 8,860 |
| Perfluorocyclobutane | c-C4F8 | 10,300 |
| Perfluoropentane | C5F12 | 13,300 |
| Perfluorohexane | C6F14 | 9,300 |
Now let's look at the graphs for CH4, Currently
Global CH4 Monthly Means
| June 2022: | 1906.11 ppb or 190ppm |
| June 2021: | 1888.47 ppb or 188ppm |
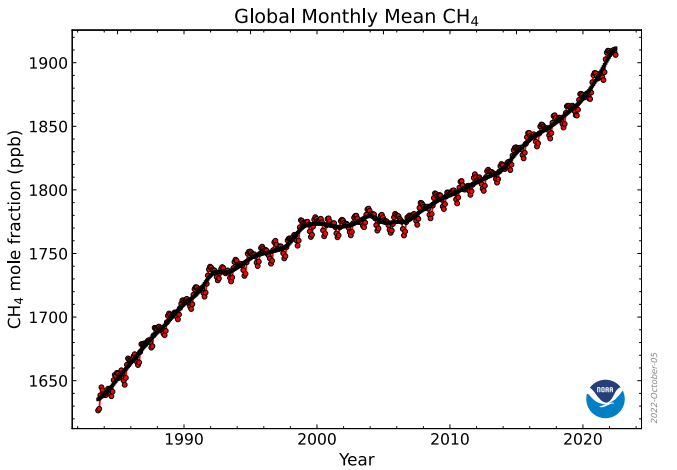
They didn't really start measuring that until around 1984, Where it was at 1600ppb or 160ppm
Now take into account the conservative GWP of 28 for CH4,
Would be 160ppm x 28gwp = 4,480ppm in 1984 , to 190ppm x 28gwp = 5,320ppm in 2022 of Co2 equivalent emissions, compare that to:
CO2 going from 350ppm to 415ppm over the same period.
For people who suck at math:
CH4 5320ppm - 4480ppm = 840ppm increase from methane emissions alone.
CO2 would be 415ppm - 350ppm = 64ppm increase from CO2 emissions
The whole reason they "seemingly" randomly switch between measurement systems (ppm vs ppb) is when they have fossil fuel shills in the climate change groups, which makes both graphs look linear, when the methane graph is following an exponential curve. That is the power of the fossil fuel frackers to destroy the world and lie about it at the same time, while mostly only advocating for solutions which require using more LNG.
the problem is so deeply embedded systemically generally side by side with right wing authoritarianism, that ignorance of all of this, destroys the fabric of society and the world order upon which it is built.
The other way of looking at it is, hooray, just disrupt the fracking for 20 years and everything will go back to normal, but that only works, if they do not cross the 2.5c threshold, at which point the accumulation of feedback loops will result in the Clathrate gun going off and causing temperatures to jump from +2.5c to +5c in less than 50 years.
The thing to understand about that is, it's not the beginning of when the Clathrate gun goes off, that is the end of the process.
Because that process is going on right now. Which is seen mostly in the permafrost thaw across most of canada and russia.
https://www.science.org/content/article/siberia-s-gateway-underworld-grows-record-heat-wave-thaws-permafrost
because this is what it looks like when temporarily frozen
https://www.ecowatch.com/siberia-sea-boiling-methane-2640900862.html
which is happening across Canada as well and is actually only half of the problem, as crazy as that might seem because of the massive scale of this problem,
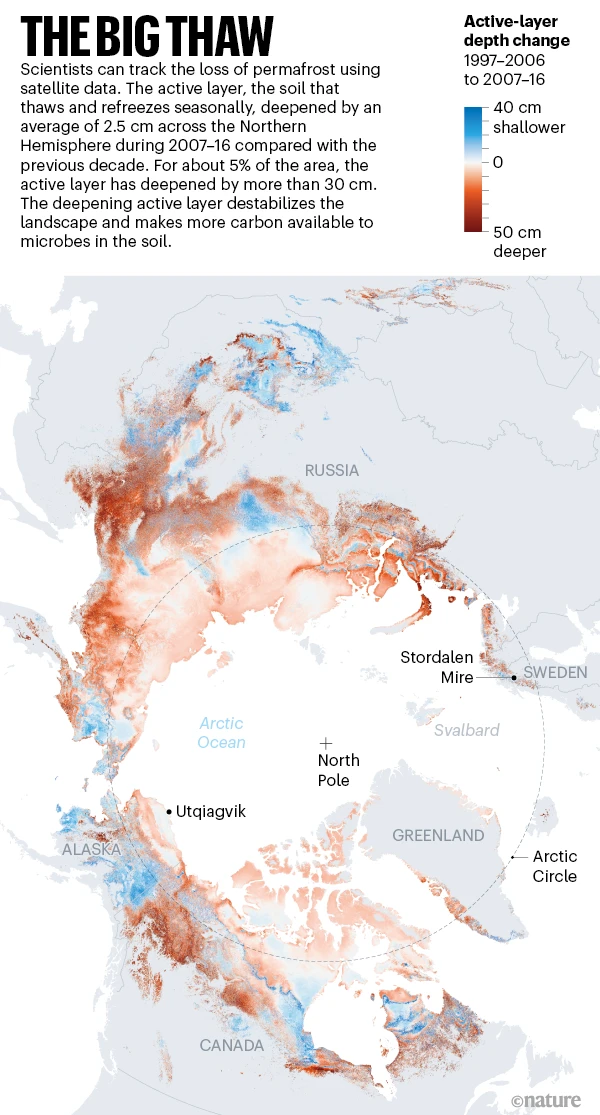
But then other half is that the areas of Canada and Russia we are talking about here, are larger than all the other countries of the west combined. And this vast wilderness then becomes covered with bacteria and other microorganisms, resulting in methane emissions greater than all human agriculture on earth combined.
https://www.nature.com/articles/d41586-021-00659-y
So it's sometimes difficult for me to explain the scale of the situation other than to be unfazed by the potential for nuclear war, because at least that would be survivable by some humans on some island somewhere. But after the Clathrate gun goes off, the environment will be too hot for most photosynthesizing organisms to survive outdoors, including algea in the ocean.
Which are responsible for almost all the oxygen on earth. On the other hand, It will be hard to start a gas powered generator, without oxygen.
Science magazine has their own writeup as well here:
https://www.science.org/doi/10.1126/science.abn7950